Sep 15 Enhancing Transit Services through Rider-Centric Interactivity
Matthew Mohebbi, CEO
info@itcurves.net
For decades, US transit agencies have grappled with the challenge of improving operational efficiency. This issue is particularly acute for rural and suburban transit operators, given the sparsely populated areas they cover, often far from major transit routes.
Transit Performance Metrics:
State and federal transportation agencies have made efforts to establish universal Key Performance Indicators (KPIs) to measure and enhance the overall performance of US transit systems. Examples of these indices include:
- Passengers served Per hour (PAX-Hr): This KPI measures the number of passengers boarding at each stop, which drives the PAX/Hr metric. While useful, it can be a rough index, as it favors routes with numerous short trips.
- Passenger Miles Per Hour (PAX-Miles-Hr): This KPI multiplies the number of passengers by the miles traveled in an hour, offering a more accurate reflection of capital and operating expenses per mile of travel.
Many other KPIs are designed to normalize these indices as percentages for comparison or benchmarking purposes. Examples include percentages of Pax-Hr/Service Hours and PAX-Miles/Service Miles, among others.
Arguably, the most critical performance indicator for transit agencies is determining their overall cost per PAX-Mile, which is often unreasonably high in rural and suburban areas. The solution lies in increasing ridership to optimize capital and operating expenses per mile traveled. However, agencies often find increasing ridership to be challenging, if not impossible, due to a lack of focus on the riders’ perspective.
Riders’ View of Performance Metrics:
A cursory examination of performance indicators reveals that they often overlook what riders truly value in public transit:
- Convenience: This is measured by the proximity of the nearest stop to a rider’s residence, workplace, or other destinations. Inconvenience, such as having to find alternative transportation to reach a suitable stop, can deter potential riders.
- Coverage: Riders want to know if their residence, workplace, and other points of interest are covered by public transit. Expanding the number and spread of stops can increase coverage and make transit more appealing to a broader population.
- Connections: The number of routes requiring transfers can lead to detours and longer travel times. Simplifying connections can make public transit more attractive.
Changing the Paradigm: Flexible Micro-Transit and Enhanced Rider Interaction
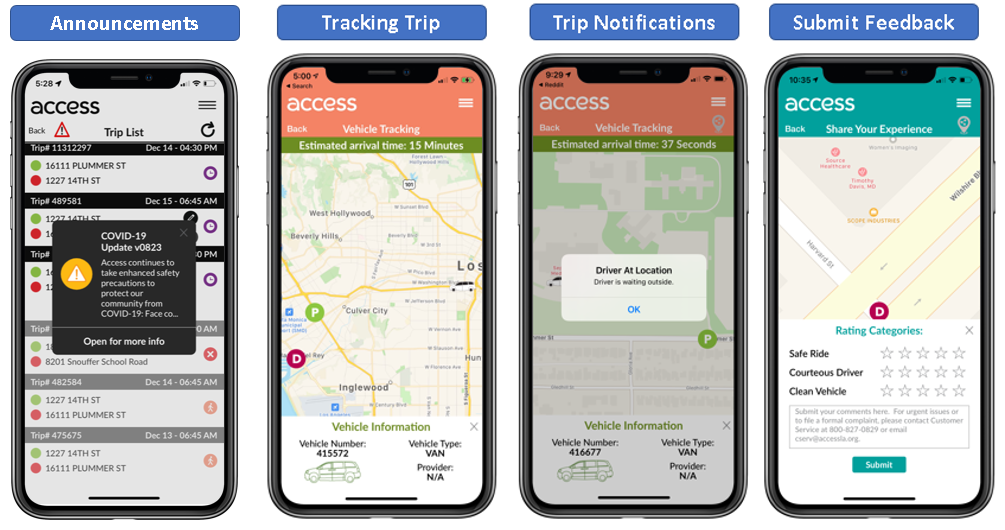
The solution lies in shifting from the traditional fixed transit model to one that leverages the capabilities of smart apps and Interactive Voice Response (IVR) systems. Today, riders can access real-time information, submit travel requests, and negotiate for the best travel options online.
This flexibility empowers transit agencies to innovate with new micro-transit services, moving away from rigid schedules and fixed stops to a demand-driven model. For instance, an agency operating 10 bus routes with 15 fixed stops each could transition to a model with three times as many virtual stops (e.g., 450) and schedule routes to stop only where there is demand. This approach increases convenience and coverage, attracting more riders, ultimately reducing costs per rider and per PAX-Mile.
While managing 450 virtual stops may seem daunting, statistical scheduling is not new to various industries. The size and timing of this paradigm shift can be controlled by agencies, but it is imperative to embark on this transformation sooner rather than later.


